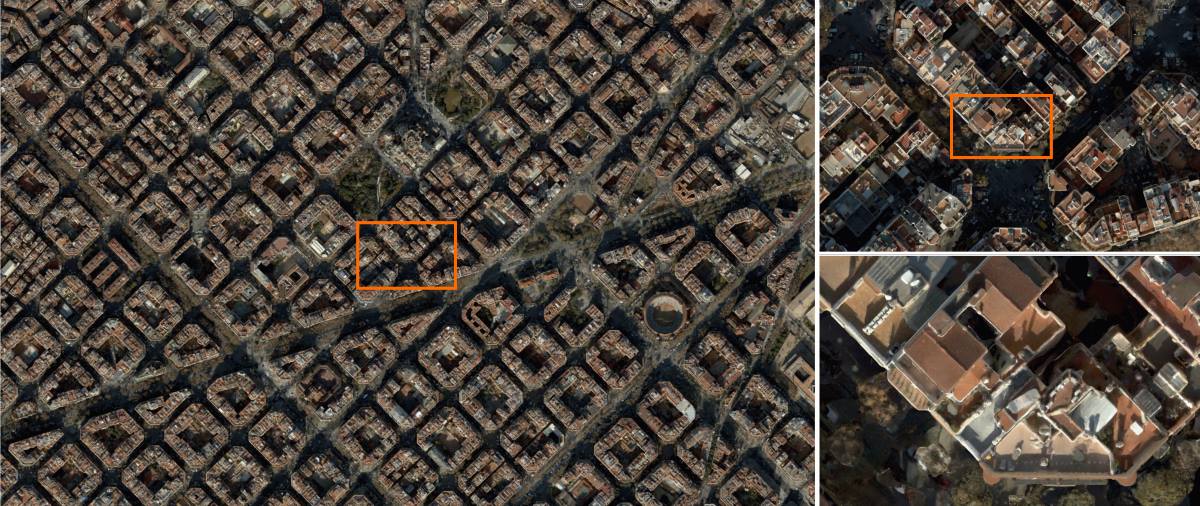
In 2014 the Institut Cartogràfic i Geològic de Catalunya (ICGC) scanned an area of 1900x1200 meters around the La Sagrada Família in the city of Barcelona using a photogrammetric camera mounted on an aircraft. The resulting 2 billion point cloud was recently uploaded to Voxxlr and is now available online.
The Voxxlr processing pipeline applied various filters to the original point cloud before creating a packet stream that is transmitted on demand to the Voxxlr online point cloud viewer. It allows users to explore the scan via a standard web browser in a manner similar to Google Earth.

The image above displays the point cloud at different zoom levels in a top-down orthographic projection up to a resolution of 7 cm. While this view appears to be a 2D image, it represents only one of many possible viewpoints. For example, the image below shows a perspective 3D view from the Sagrada Familia looking towards the La Monumental arena. The structure in the foreground on the right is a spire of the cathedral.

As part of post-processing, Voxxlr also calculates surface normals for each point. This additional topographical information supports powerful visualization and analysis methods. For example, the left hand side of the image below shows a city block in color. The right hand side shows the same block using black and white Phong Shading, which is a computer graphic illumination model based on how light reflects from surfaces. Note how the uniform illumination uncovers features which are hidden by shadows in the image on the left.

Lighting techniques can also be used to emphasize other attributes of the data. For example, the image below shows a colored section of the city followed by the same section illuminated using elevation as a color scale. The lower image reveals detailed structural artefacts and provides an impression of how much the Sagrada Familia towers above the neighborhood. It also reveals subtle elevation differences in the surrounding buildings as well as the slope of the underlying terrain.

Since the estimated surface normals capture the slope at any given point, it becomes possible to filter the point cloud by a specific inclination. In the case of a city, points with a slope close to 90 degrees are mostly part of building facades. In a top-drown orthographic projection, this filter effectively creates a street map as shown in the image below.

This article mainly relies on orthographic projections to illustrate the different visualization techniques. However, coloring and illumination are viewpoint independent, and can thus be examined from any 3D perspective as shown in the image below. Voxxlr also provides tools to define clipping planes, add annotations, take measurements and even import external 3D content such as architectural models. Since Voxxlr is based on the Google Cloud infrastructure, it can handle massive data sets and is available online 24/7. Soon, the point cloud processing pipeline will also apply clustering algorithms to automatically classify points into categories such as vegetation, roads, roofs etc. Stay tuned for another article presenting the results of this development.

The point cloud presented in this article is available online at Voxxlr, either in the easy to use viewer or the more comprehensive editor, where you can explore additional features. If you would like to experiment with your own data sets simply log in at www.voxxlr.com and upload either a las, e57, pts or ply file. For any question, please contact info@voxxlr.com.
Comments
Post a Comment